
 Dr. Dieter Menne
 07072 1263 688

What we present
 On this page we present technical details and cookbook examples how to use the open source statistical framework R to estimate parameters of gastric emptying with the standard power exponential function
(Elashoff et al, 1982) and our LinExp model.
On this page we present technical details and cookbook examples how to use the open source statistical framework R to estimate parameters of gastric emptying with the standard power exponential function
(Elashoff et al, 1982) and our LinExp model.
This page complements three papers on the LinExp model by the Gastric Motility Workgroup at the ETH and the University Hospital of Zürich. The first paper is more technical, the other two present study results analyzed with LinExp.. 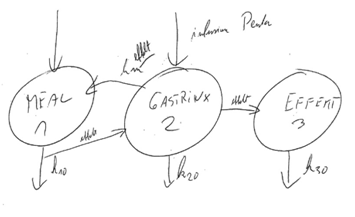
- Steingötter A, Schwizer W, Menne D: Pharmacometrics and quantitative MRI for the analysis of gastric emptying and secretion: The effect of pentagastrin on meal emptying and gastric secretion (submitted) Technical paper with NONMEM PK-PD modeling. Meal and secretion flow are handled as first order models, modulated by gastrin and pentagastrin infusion.
- Goetze O, Steingoetter A, Menne D, van der Voort I R , Kwiatek M A, Boesiger P, Weishaupt D, Thumshirn M, Fried M, Schwizer W (2006). The effect of macronutrients on gastric volume responses and gastric emptying in humans - a magnetic resonance imaging study. The American Journal of Physiology-Gastrointestinal and Liver Physiology
- Kwiatek MA, Steingoetter A, Pal A, Menne D, Brasseur JA, Hebbard G, Boesiger P, Thumshirn M, Fried M, Schwizer W (2006) Quantification of antral contractile motility in healthy human stomach with magnetic resonance imaging. Journal of magnetic resonance imaging.
- For a more recent view that introduces the concept of gastric emptying curves in a population pharmacodynamic context, see my talk at NGM09 in Chicago.
- R package gastempt on github is an open-source package for analysis of gastric emptying time series; it can be tested as an interactive Shiny web application. The package is being extended to use Bayesian nonlinear modeling with Stan.
Samples of Gastric Emptying Analysis
- gastempt1: A vanilla version, showing how to read in a data set, analyze the emptying curves individually (including failures), and process the whole set of study data in one analysis. No graphics, just numbers are generated.
- gastemp2: Extends gastempt1 by adding graphics for diagnostic and display.
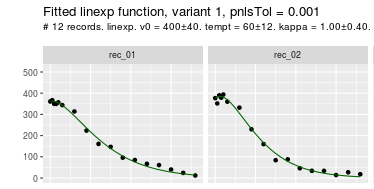
- gastempt3: Shows how the same method can be used to fit the conventional power exponential function, and compares the solutions with both methods.
What you need
- Download and install R from a mirror of CRAN close to you.
- Install the package nlme. Under Windows, the easiest way to do this is to start RGui and use menu item Packages/Install packages. We will mainly use the functions nlme and lme in this package, but it contains everything you need to analyze linear and non-linear mixed effect models.
- Get the book: Pinheiro PC, Bates DM (2000) Mixed-Effects Models in S and S-Plus. Springer, ISBN 0-387-98957-0. It is packed with examples from biomedical research, and you will certainly consult is more than once.
- Install RStudio as an IDE for developing R programs
- Download and unzip the example data file into your R work directory. It contains stomach volume data of 3 subjects and two meals from the study by Goetze et. al which we will use for the examples. You can also download all data and programs as a Zip-file.
- Other stuff
- All examples and data as a Zip-file.
- An Add-In for Excel to convert kappa and tempt from the LinExp fit to t50.